
By The
Numbers
NWBC regularly collaborates with experts by elevating data and research to tell the story of America’s women entrepreneurs. Whether the Council is commissioning research through contracts, working with agencies through an interagency agreement, or leaning on partnerships to amplify recently published findings, the Council is constantly strengthening its connection to researchers and thought leaders to advance women’s entrepreneurship, one study and statistic at a time. This year, the Council:
Because all these initiatives are currently ongoing, the following sections encapsulate preliminary, notable takeaways and exciting insights from each. We are grateful to Geri Stengel (Ventureneer), Susana Martinez Restrepo (CoreWoman), Angela Dingle (WIPP), Adji Fatou Diagne (U.S. Census Bureau), Kajal Kapur (Kapur Energy Environment Economics, LLC (KEEE)), Regina Firpo-Triplett (dfusion, Inc.), and the outstanding teams they work with to produce groundbreaking research on women’s entrepreneurship.
We are incredibly appreciative that Ventureneer, CoreWoman, and WIPP permitted a selection of findings from their ongoing research, in collaboration with Wells Fargo, to be previewed in this annual report. The 2023 Impact of Women-Owned Businesses Report “chronicles the economic upheaval caused by COVID-19 and how it opened opportunities for women to launch new businesses and grow their existing businesses.” The report projects that, “14 million women-owned businesses make up 39.1 percent of all U.S. businesses—a 13.6 percent increase from 2019 to 2023— and they are coming out of the pandemic stronger than the 2008 financial crisis, especially those owned by women of color.” This Council has been able to witness the small business boom firsthand and now has even more numbers to prove that women, particularly women of color, have driven it.
We are not the only ones keeping an eye on women’s post-pandemic economic impact. The U.S. Senate Committee on Small Business and Entrepreneurship mentioned in a recent report that women are creating “about half of new businesses for the third year in a row.”1 President Biden cited the same statistic in remarks he shared during Women’s History Month, adding that women-owned businesses “add $1.8 trillion to America’s gross domestic product every year, and that number grows.”2 Administrator Guzman echoed this sentiment during NWBC’s September 2023 Public meeting as well.
Many are aware of the impact women-owned businesses have had on our nation’s economic recovery. The 2023 Wells Fargo Impact of Women-Owned Businesses Report also captures several more detailed insights worthy of greater awareness.
The report considers the economic clout of women-owned businesses through ranking states— including Washington D.C.—and the top 50 Metropolitan Statistical Areas (MSAs). Economic clout can be defined as the combined growth in the number of firms and employment and average shares in firms, employment, and revenue of women-owned businesses from 2019 to 2023. Some clear trends emerge from this ranking, including that the top-ranked states and MSAs prioritize offering access to resources, tax incentives, mentorship, capital, networks, and training to support entrepreneurship, including tailoring outreach and offerings to women business owners. Investment in women’s entrepreneurship cannot just come from the national level; there are clear benefits to state and local economies when they are empowered to bolster women’s entrepreneurship. Given the Council Members’ wide geographic reach, they will continue to share stories from their localities and states to uplift best practices, lessons learned, and powerful stories to complement data like these.
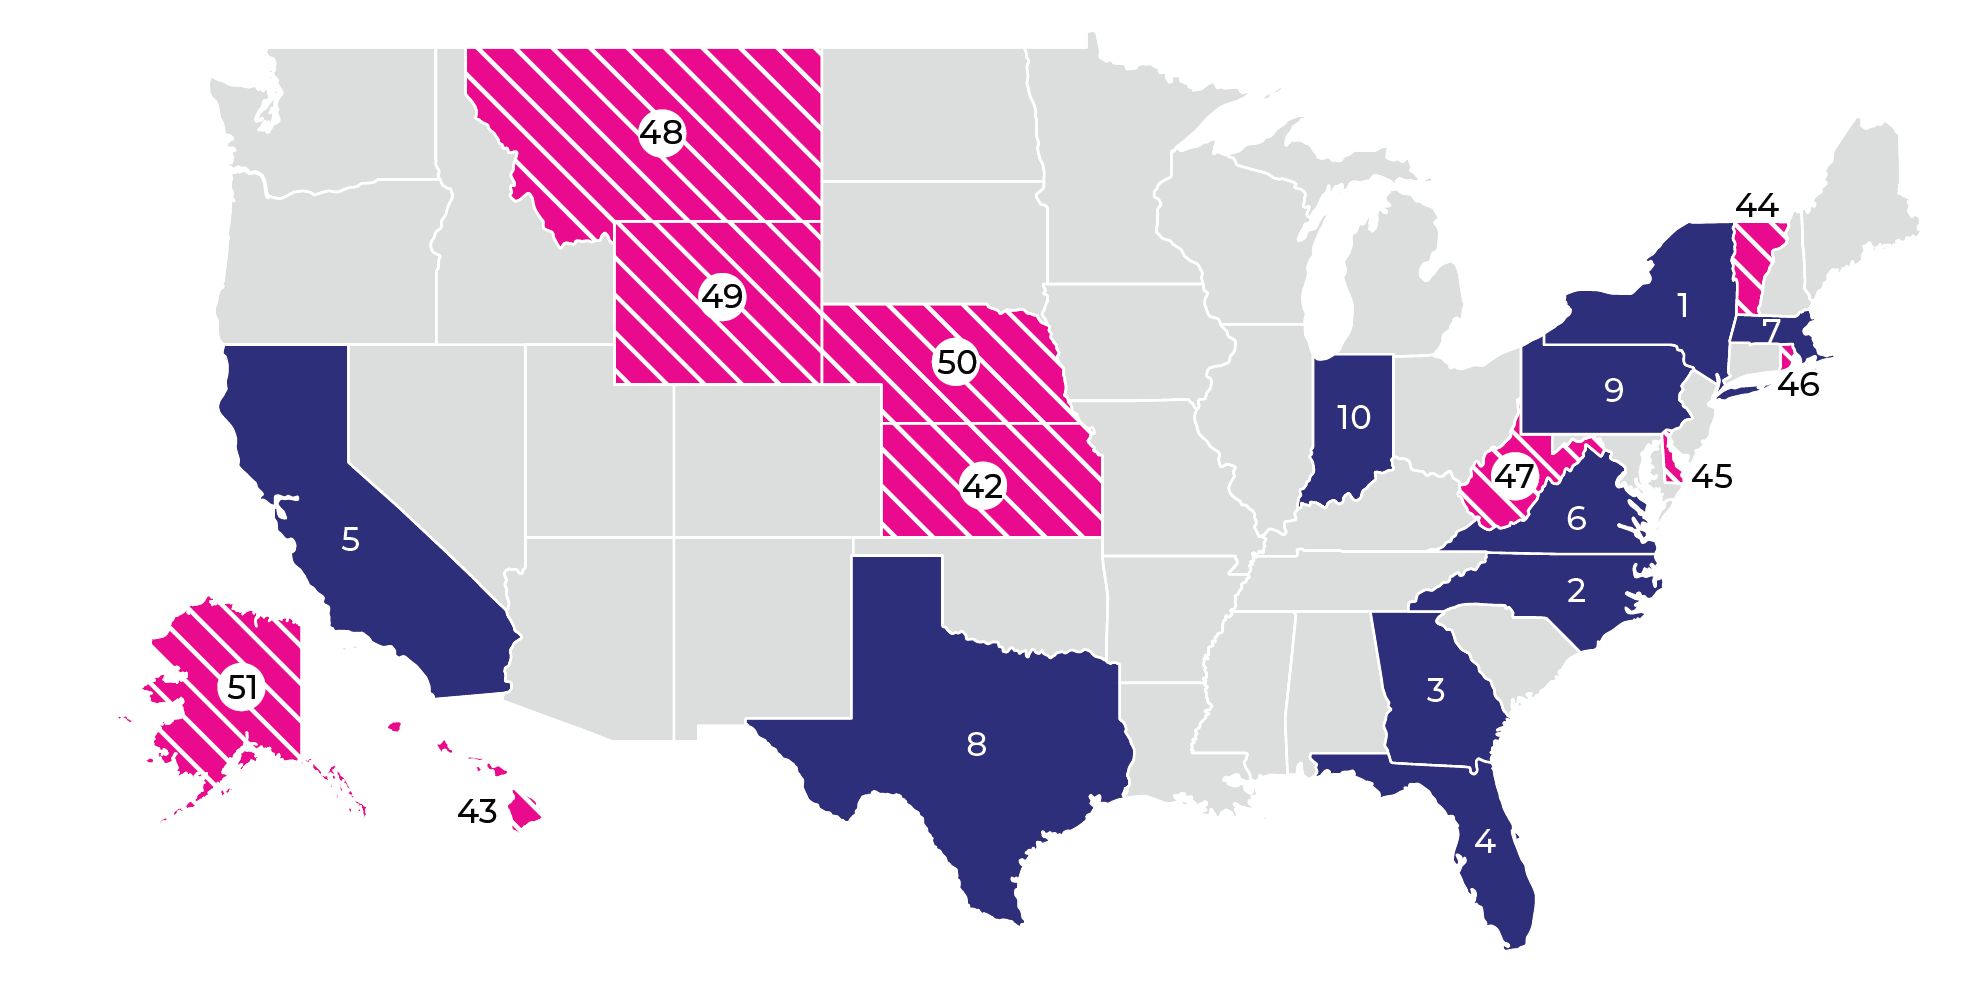
1. New York
2. North Carolina
3. Georgia
4. Florida
5. California
6. Virginia
7. Massachusetts
8. Texas
9. Pennsylvania
10. Indiana
42. Kansas
43. Hawaii
44. Vermont
45. Delaware
46. Rhode Island
47. West Virginia
48. Montana
49. Wyoming
50. Nebraska
51. Alaska
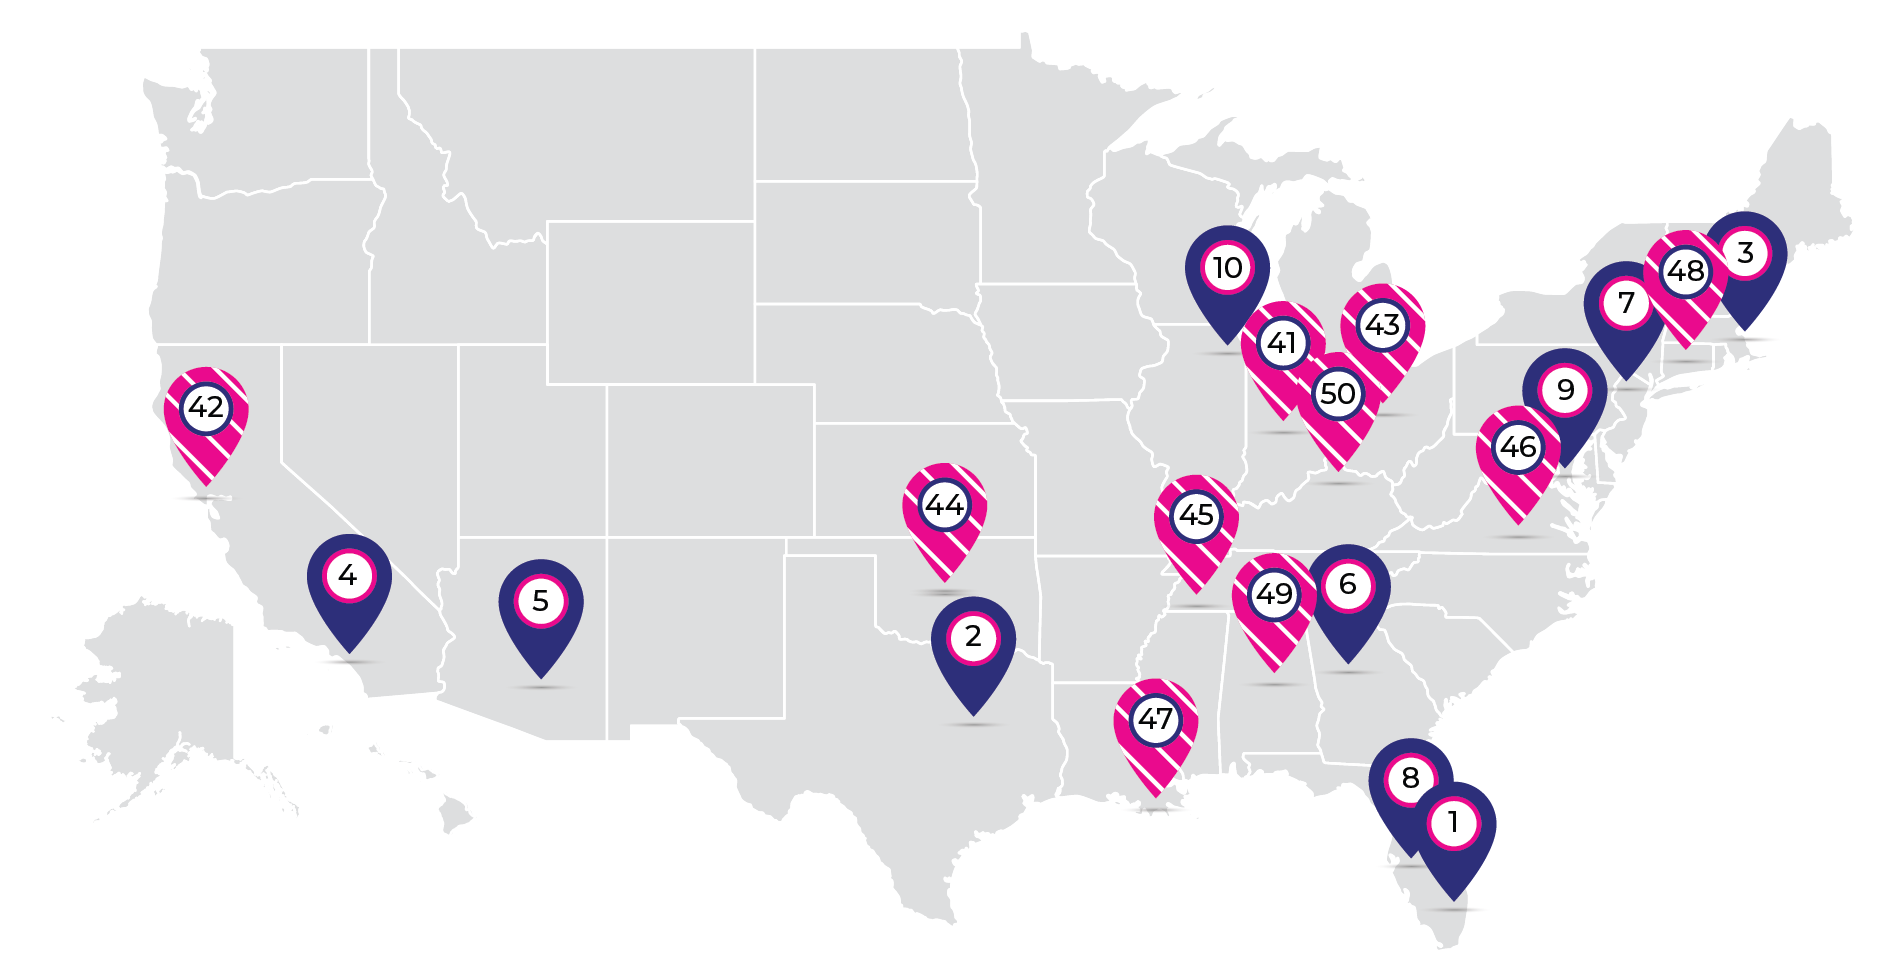
1. Miami-Fort Lauderdale-West Palm Beach, FL
2. Dallas-Fort Worth-Arlington, TX
3. Boston-Cambridge-Newton, MA-NH
4. Los Angeles-Long Beach-Anaheim, CA
5. Phoenix-Mesa-Scottsdale, AZ
6. Atlanta-Sandy Springs-Roswell, GA
7. New York-Newark-Jersey City, NY-NJ-PA
8. Tampa-St. Petersburg-Clearwater, FL
9. Washington-Arlington-Alexandria, DC-VA-MD-WV
10. Chicago-Naperville-Elgin, IL-IN-WI
41. Indianapolis-Carmel-Anderson, IN
42. San Jose-Sunnyvale-Santa Clara, CA
43. Columbus, OH
44. Oklahoma City, OK
45. Memphis, TN-MS-AR
46. Richmond, VA
47. New Orleans-Metairie, LA
48. Hartford-West Hartford-East Hartford, CT
49. Birmingham-Hoover, AL
50. Louisville/Jefferson County, KY-IN
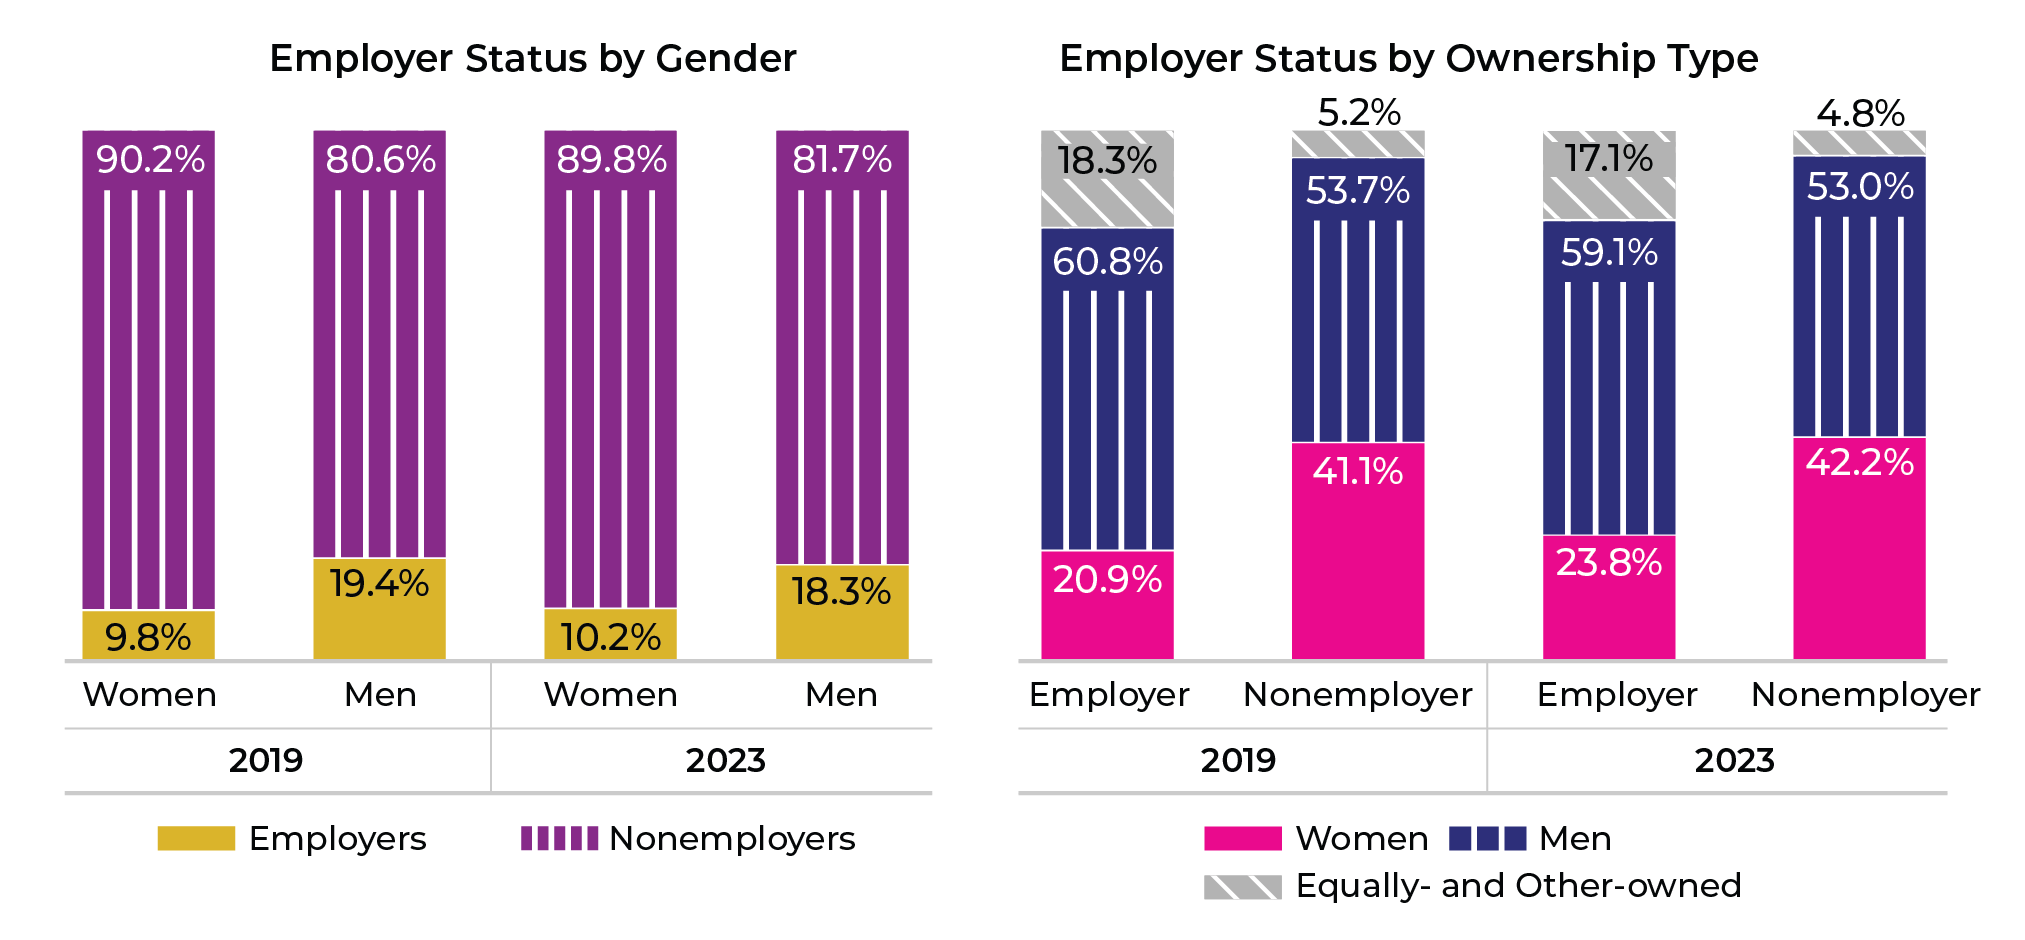
The report does an exemplary job of noting patterns sustained and changed during the COVID-19 pandemic. During economic instability, employer firms tend to shrink while nonemployer firms grow. However, during the recent pandemic, both employer and nonemployer firms grew. In fact, the growth of women-owned businesses in both categories outpaced that of their male-owned counterparts. The share of all women-owned employers increased from 9.8 percent in 2019 to 10.2 percent in 2023, while men’s share decreased from 19.4 percent to 18.3 percent. While women’s share of all U.S. employer firms is only 23.8 percent compared to 59.1 percent for men-owned businesses, progress is progress. Correspondingly, women’s share of all nonemployer firms grew from 41.1 percent in 2019 to 42.2 percent in 2023.
Consider the impact of women-owned employer and nonemployer businesses.
At the time of writing, two demographic-specific analyses from the report were made available. The Council anticipates greater exploration of demographic trends in women’s business ownership will be shared and will account for other races and ethnicities as well as the ones shared below. Disaggregated data on entrepreneurship based on race and gender makes an incredible difference when considering intersectionality and the compounding effects of discrimination. The gratitude the Council has for the work already occurring to paint a clearer and more equity-focused picture of entrepreneurship cannot be understated.
Black/African American women-owned businesses:
Businesses owned by Black/African American women closed at higher rates than other businesses during the COVID-19 pandemic, likely because they tend to be younger, generate less revenue, were less likely to receive aid, and are concentrated in industries that were more vulnerable to the economic and workplace shocks linked with the pandemic. Despite these
challenges, average revenues for these businesses increased 32.7 percent to $47,300 between 2019 and 2023 compared to all women-owned businesses’ 12.1 percent rise to $192,600.

Hispanic/Latino women-owned businesses:
During the pandemic, Hispanic/Latino women-owned businesses fell behind all women-owned businesses in terms of firm growth rate but exceeded the growth of Hispanic/Latino men. Likewise, Hispanic/Latino women experienced robust growth in employment and revenue. Despite being left out of the initial Paycheck Protection Program rollout, average revenues for these businesses increased 17.1 percent between 2019 and 2023 compared to all women-owned businesses’ 12.1 percent rise.

As was the case for Black/African American women-owned businesses, closing revenue gaps for Hispanic/Latino women-owned businesses can boost the U.S. economy by billions of dollars, considering that:
Women, particularly women of color, have led the U.S. economy’s post-pandemic rebound and small business boom. Only by continuing to raise the bar, close the gaps, and give the dollars can this growth be sustained.
As a continuation of previous interagency agreements between the Council and the U.S. Census Bureau’s Center for Economic Studies, Adji Fatou Diagne, PhD, kindly assembled the following preliminary landscape analysis of women’s business ownership. This analysis will serve as the basis for future inquiry into trends in women’s business ownership and was conducted based on data from the U.S. Census Bureau’s 2019 Annual Business Survey and 2018 Nonemployer Statistics by Demographics (NES-D). Analyses such as this are invaluable in illustrating the experiences of women business owners across the country and throughout their entrepreneurial journeys. With better data comes better-informed recommendations for change.
Women-owned businessesi were relatively younger than the population of all U.S. firms in 2018. Among women-owned firms, 35.1 percent were in operation three years or less, compared with 32.8 percent for all U.S. firms. Similarly, 32.2 percent of women-owned firms had been in business for 11 or more years, compared with 36.7 percent among all U.S. firms. Nonemployer womenowned firms (excluding C corporations) also slightly mirrored these trends, with 35.6 percent in business for three years or less and 31.4 percent in business for 11 or more years. This tendency is reversed when looking at women-owned employer firms, which were much older, with 39.8 percent active for 11 or more years.
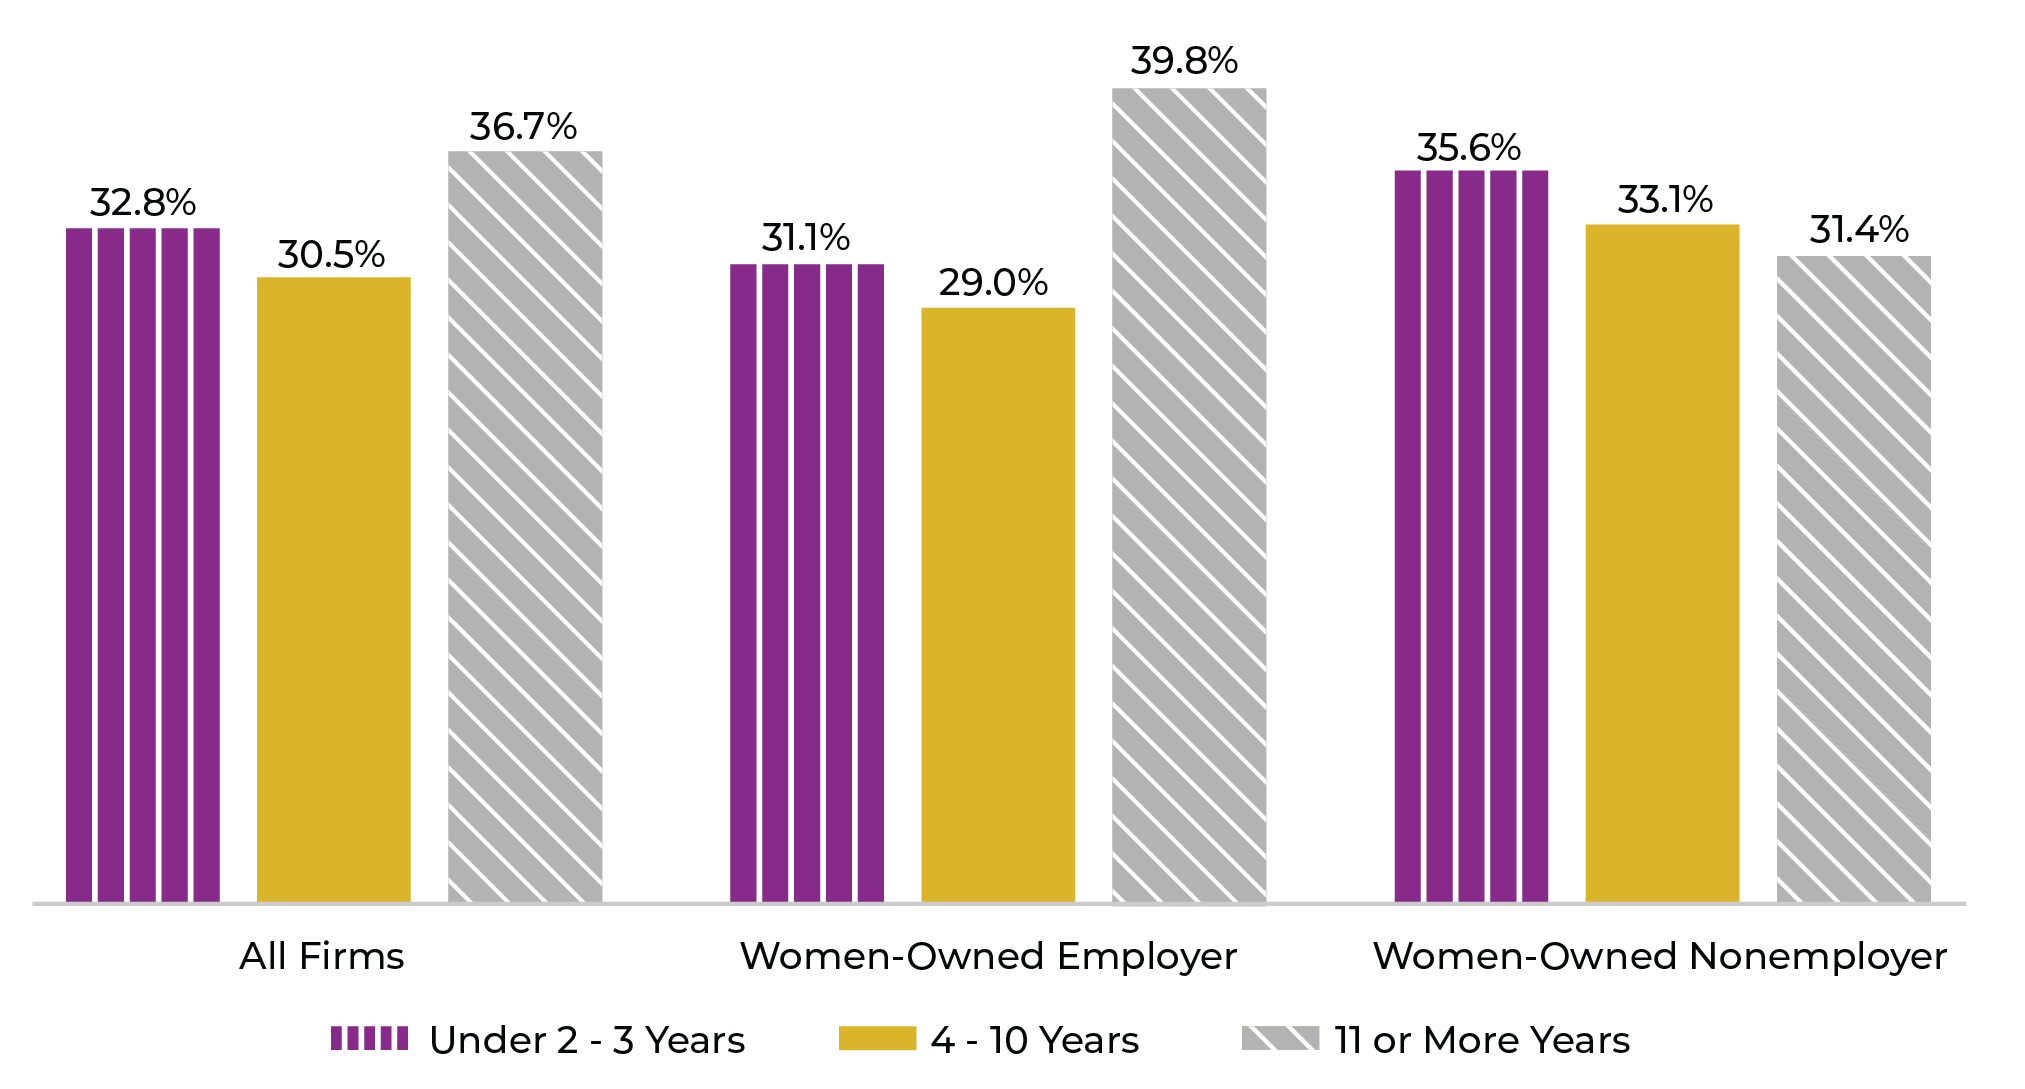
Source: U.S. Census Bureau, 2019 Annual Business Survey and 2018 Nonemployer Statistics by Demographics (NES-D)
Women business owners were relatively older in 2018, with 77.2 percent over the age of 35—in line with the age distribution of all U.S. firm owners, 80.2 percent over 35 years old.ii Nonemployer firm owners also slightly followed similar age trends as those women-owned and all business owners in general. This pattern of business ownership by age was much higher than the general age distribution of women in the country in 2018, with over half (55.9 percent) over the age of 35.4 Stark differences arise when we look at women employer business owners where only 5.8 percent were under the age of 35 and nearly half (48.9 percent) were over 55 years old.
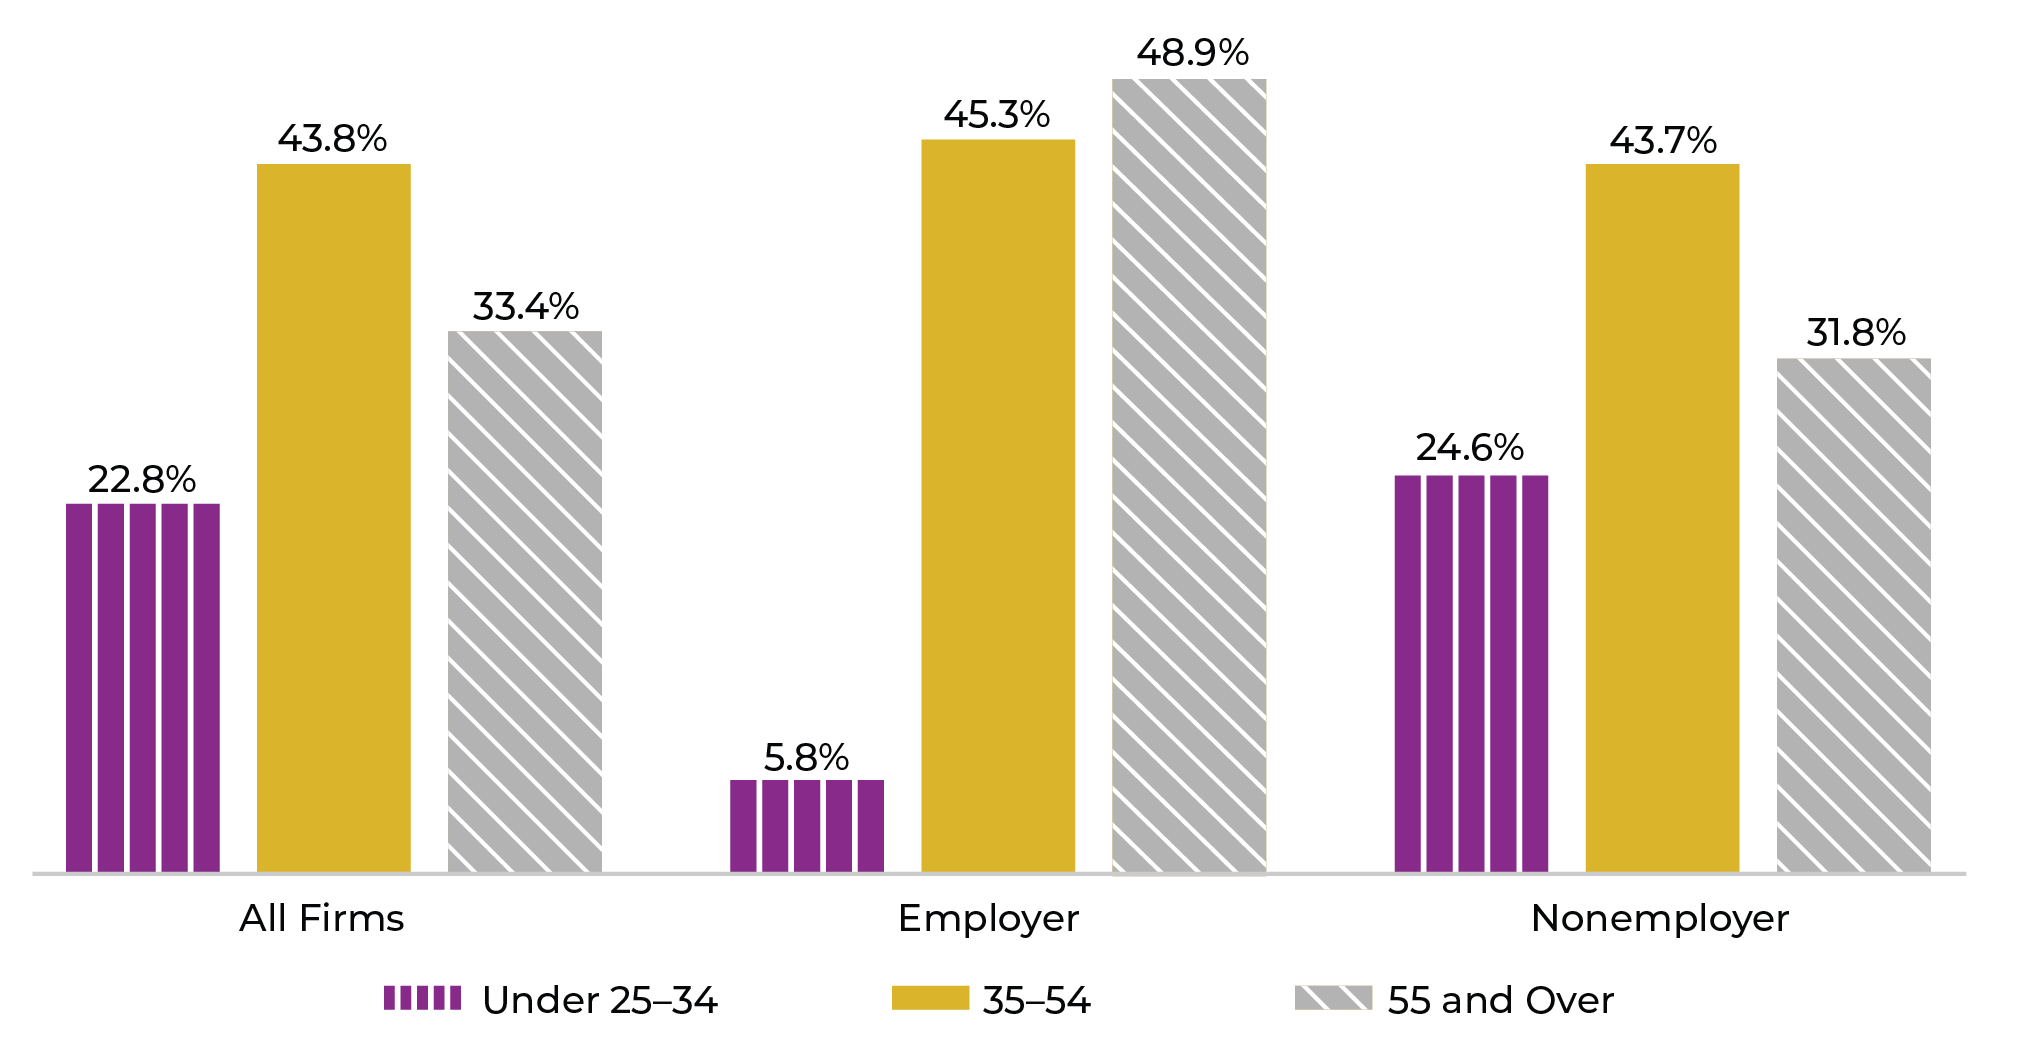
Source: U.S. Census Bureau, 2019 Annual Business Survey and 2018 Nonemployer Statistics by Demographics (NES-D)
There were about 1.6 million non-U.S. citizen women-owned businesses in 2018, accounting for 11.8 percent of all businessesiii compared to 13.9 percent for men-owned. Business ownership among non-citizen women and men, who made up 8.2 percent and 9.1 percent of the female and male adult population in 2018, respectively, is overrepresented.5 Women business ownership among non-U.S. citizens was 37.2 percent, with nearly all (97.5 percent) recorded as nonemployer firms.
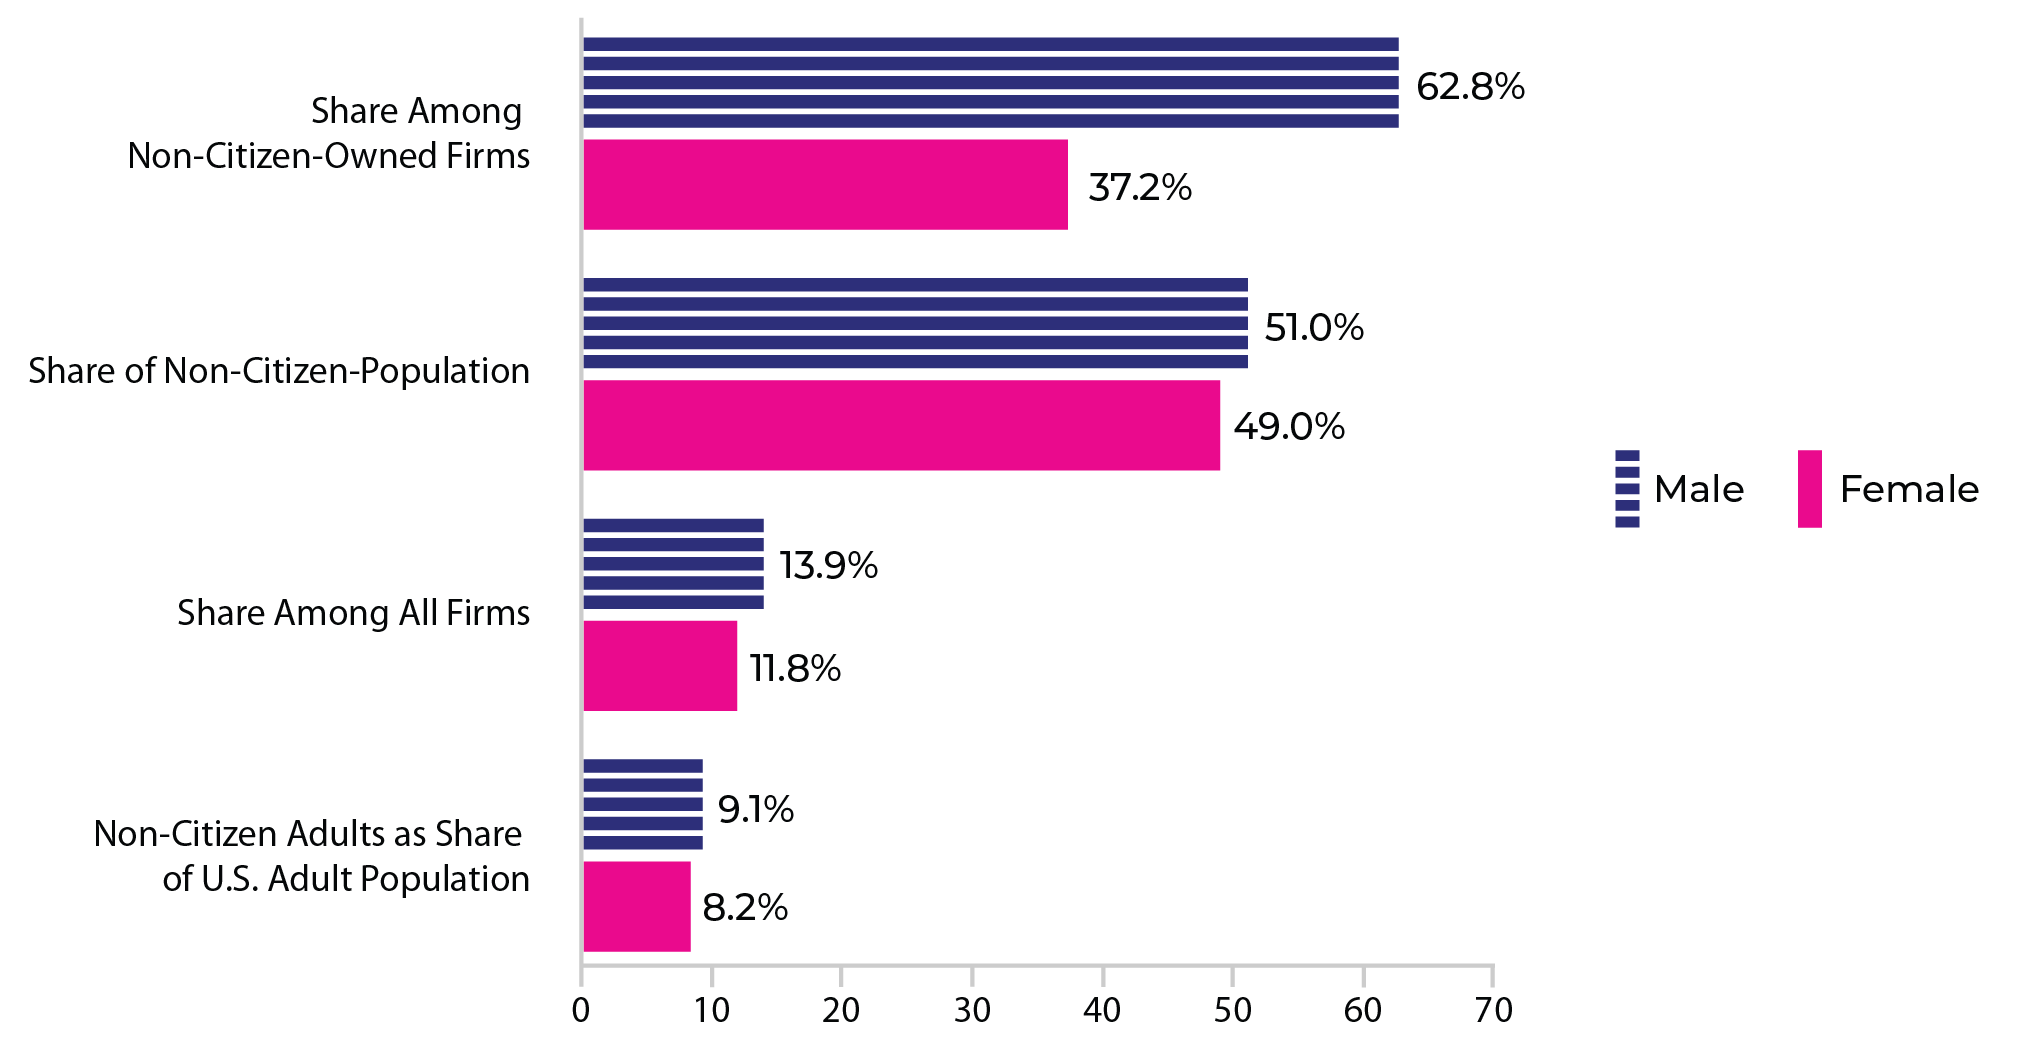
Sources: U.S. Census Bureau and National Center for Science and Engineering Statistics, 2019 Annual Business Survey (data year 2018), 2018 Nonemployer Statistics by Demographics (NES-D), U.S. Census Bureau, Current Population Survey, and 2018 Annual Social and Economic Supplements
Women-owned firms were mainly concentrated in the District of Columbia, Georgia, Hawaii, and Mississippi where they accounted for 40 percent or more of all businesses in 2018. California, Texas, and Florida had the highest numbers of women-owned businesses and made up 31.6 percent of all women-owned firms in the U.S. Delaware, South Dakota, Wyoming, and New Jersey were among the states with the lowest share of women-owned businesses. Total womenowned firm statistics were unavailable for North Dakota and Rhode Island.iv
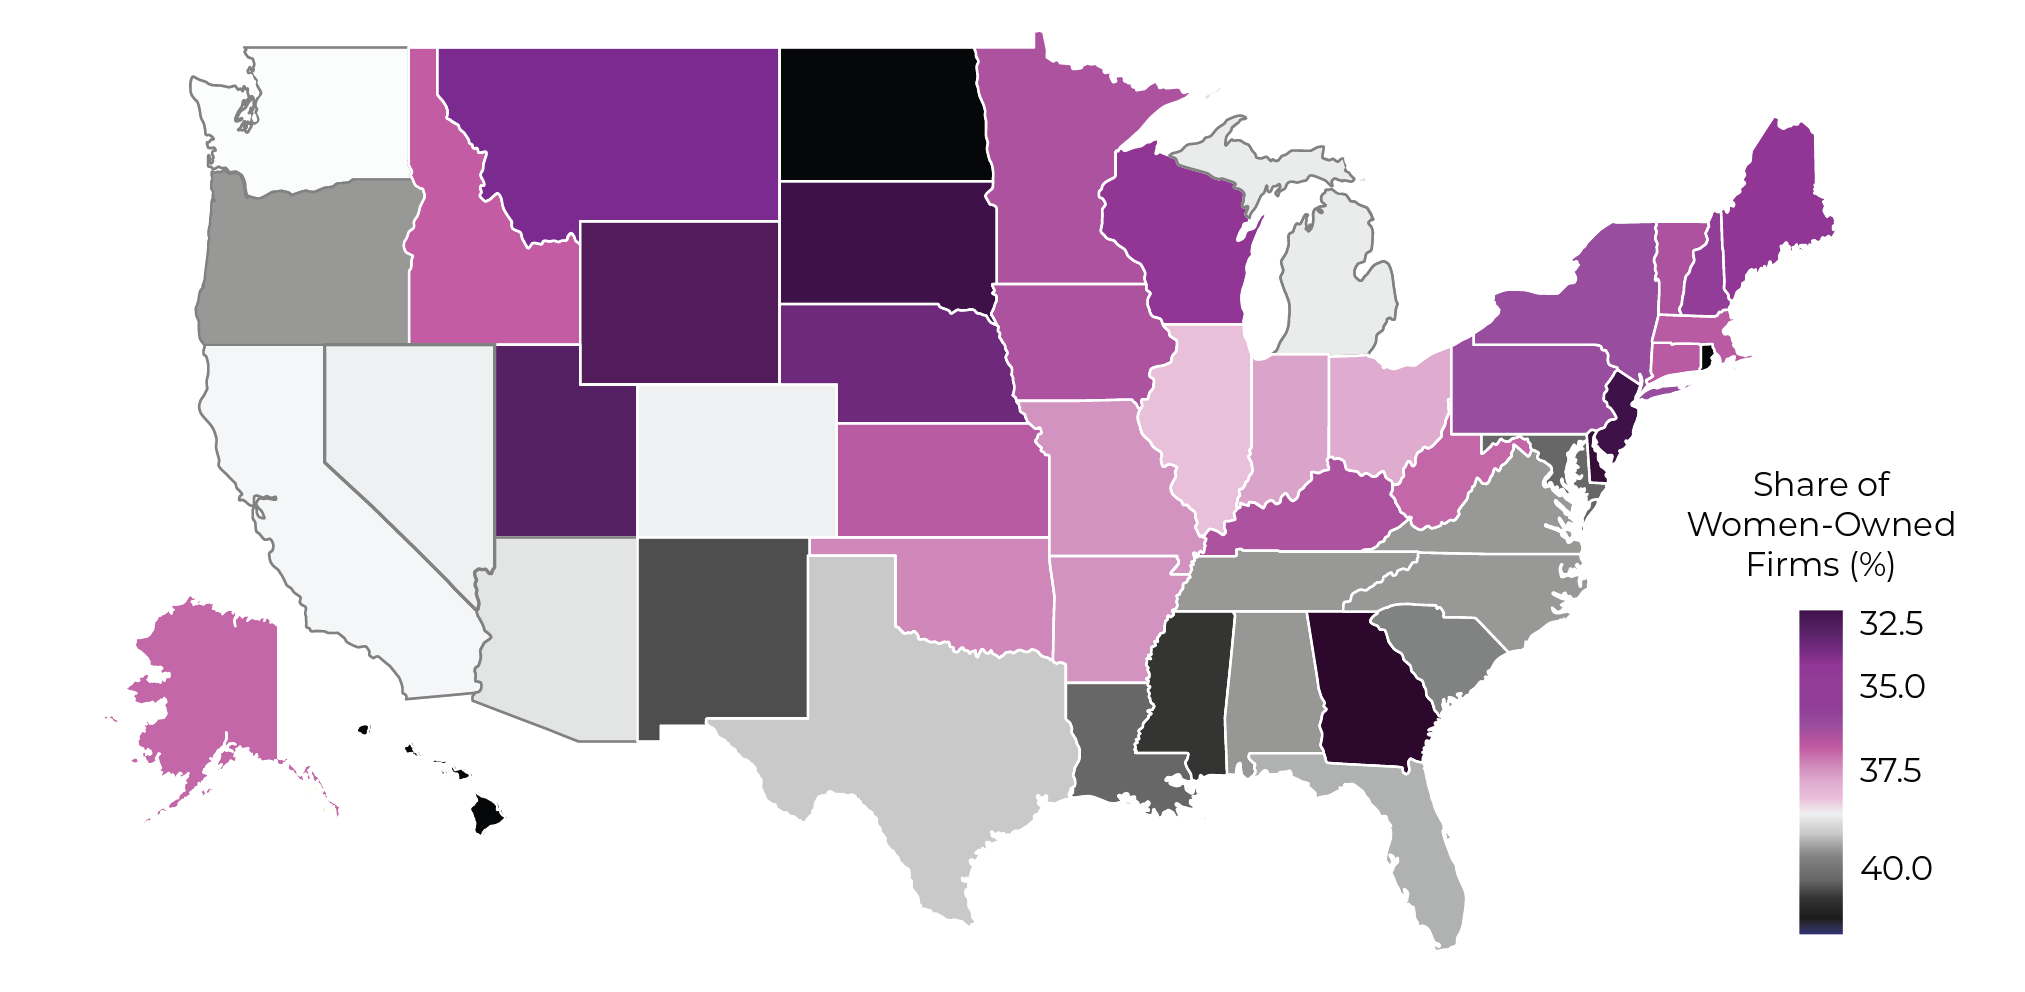
Source: U.S. Census Bureau, 2019 Annual Business Survey, and 2018 Nonemployer Statistics by Demographics (NES-D)
The top three metropolitan areas with the largest share of women-owned businesses in the country are in the south, including the Memphis, Tennessee-Mississippi-Arkansas (TN-MS-AR) Metro Area (46.3 percent), the Albany, GA Metro Area (45.0 percent), and Columbus, GA Metro Area (43.4 percent). Ocean City, NJ Metro Area (29.4 percent), Cheyenne, WY Metro Area (29.8 percent), and Erie, PA Metro Area (29.9 percent) are among the MSAs with the lowest share of women-owned firms.
| Metropolitan Statistical Areas (MSA) | Percent |
|---|---|
| Memphis, TN-MS-AR Metro Area | 46.3 |
| Albany, GA Metro Area | 45.0 |
| Memphis, TN-MS-AR Metro Area | 46.3 |
| Albany, GA Metro Area | 45.0 |
| Memphis, TN-MS-AR Metro Area | 46.3 |
| Albany, GA Metro Area | 45.0 |
| Memphis, TN-MS-AR Metro Area | 46.3 |
| Albany, GA Metro Area | 45.0 |
| Memphis, TN-MS-AR Metro Area | 46.3 |
| Albany, GA Metro Area | 45.0 |
| Bottom 10 Metropolitan Statistical Areas (MSA) | Percent |
|---|---|
| Ocean City, NJ Metro Area | 29.4 |
| Cheyenne, WY Metro Area | 29.8 |
| Erie, PA Metro Area | 29.9 |
| Williamsport, PA Metro Area | 30.2 |
| Wausau, WI Metro Area | 30.4 |
| State College, PA Metro Area | 30.6 |
| Eau Claire, WI Metro Area | 30.6 |
| Vineland-Bridgeton, NJ Metro Area | 30.6 |
| Logan UT-ID Metro Area | 30.9 |
| Dalton, GA Metro Area | 31.1 |
Source: U.S. Census Bureau, 2019 Annual Business Survey, and 2018 Nonemployer Statistics by Demographics (NES-D)
Analyses from Wells Fargo’s report and the U.S. Census Bureau can tell us the “what,” showing what the numbers look like, what the landscape of women’s entrepreneurship looks like statistically, and in some cases, the “where,” like where women entrepreneurs are thriving, and where they may be left behind. But to understand the “why” and the “how” of it all, why these trends are taking place, and how we can make an impact through policy requires a deeper dive. This research would connect individual experiences and stories with samples, studies, and surveys to add color between the lines already sketched through the data analyses. While we look forward to more closely examining the phenomena captured through the above analyses through continued research, we are also proud to share the preliminary findings of two such deep dives we initiated this year.
The first of the two research projects is being conducted in partnership with KEEE. It is focused on learning more about how women pursue entrepreneurship in science, technology, engineering, and mathematics (STEM), particularly high-yield and high-growth industries. A more in-depth analysis will be made available to the public upon completion of the project. Until then, a few key takeaways from the ongoing research are worth highlighting.
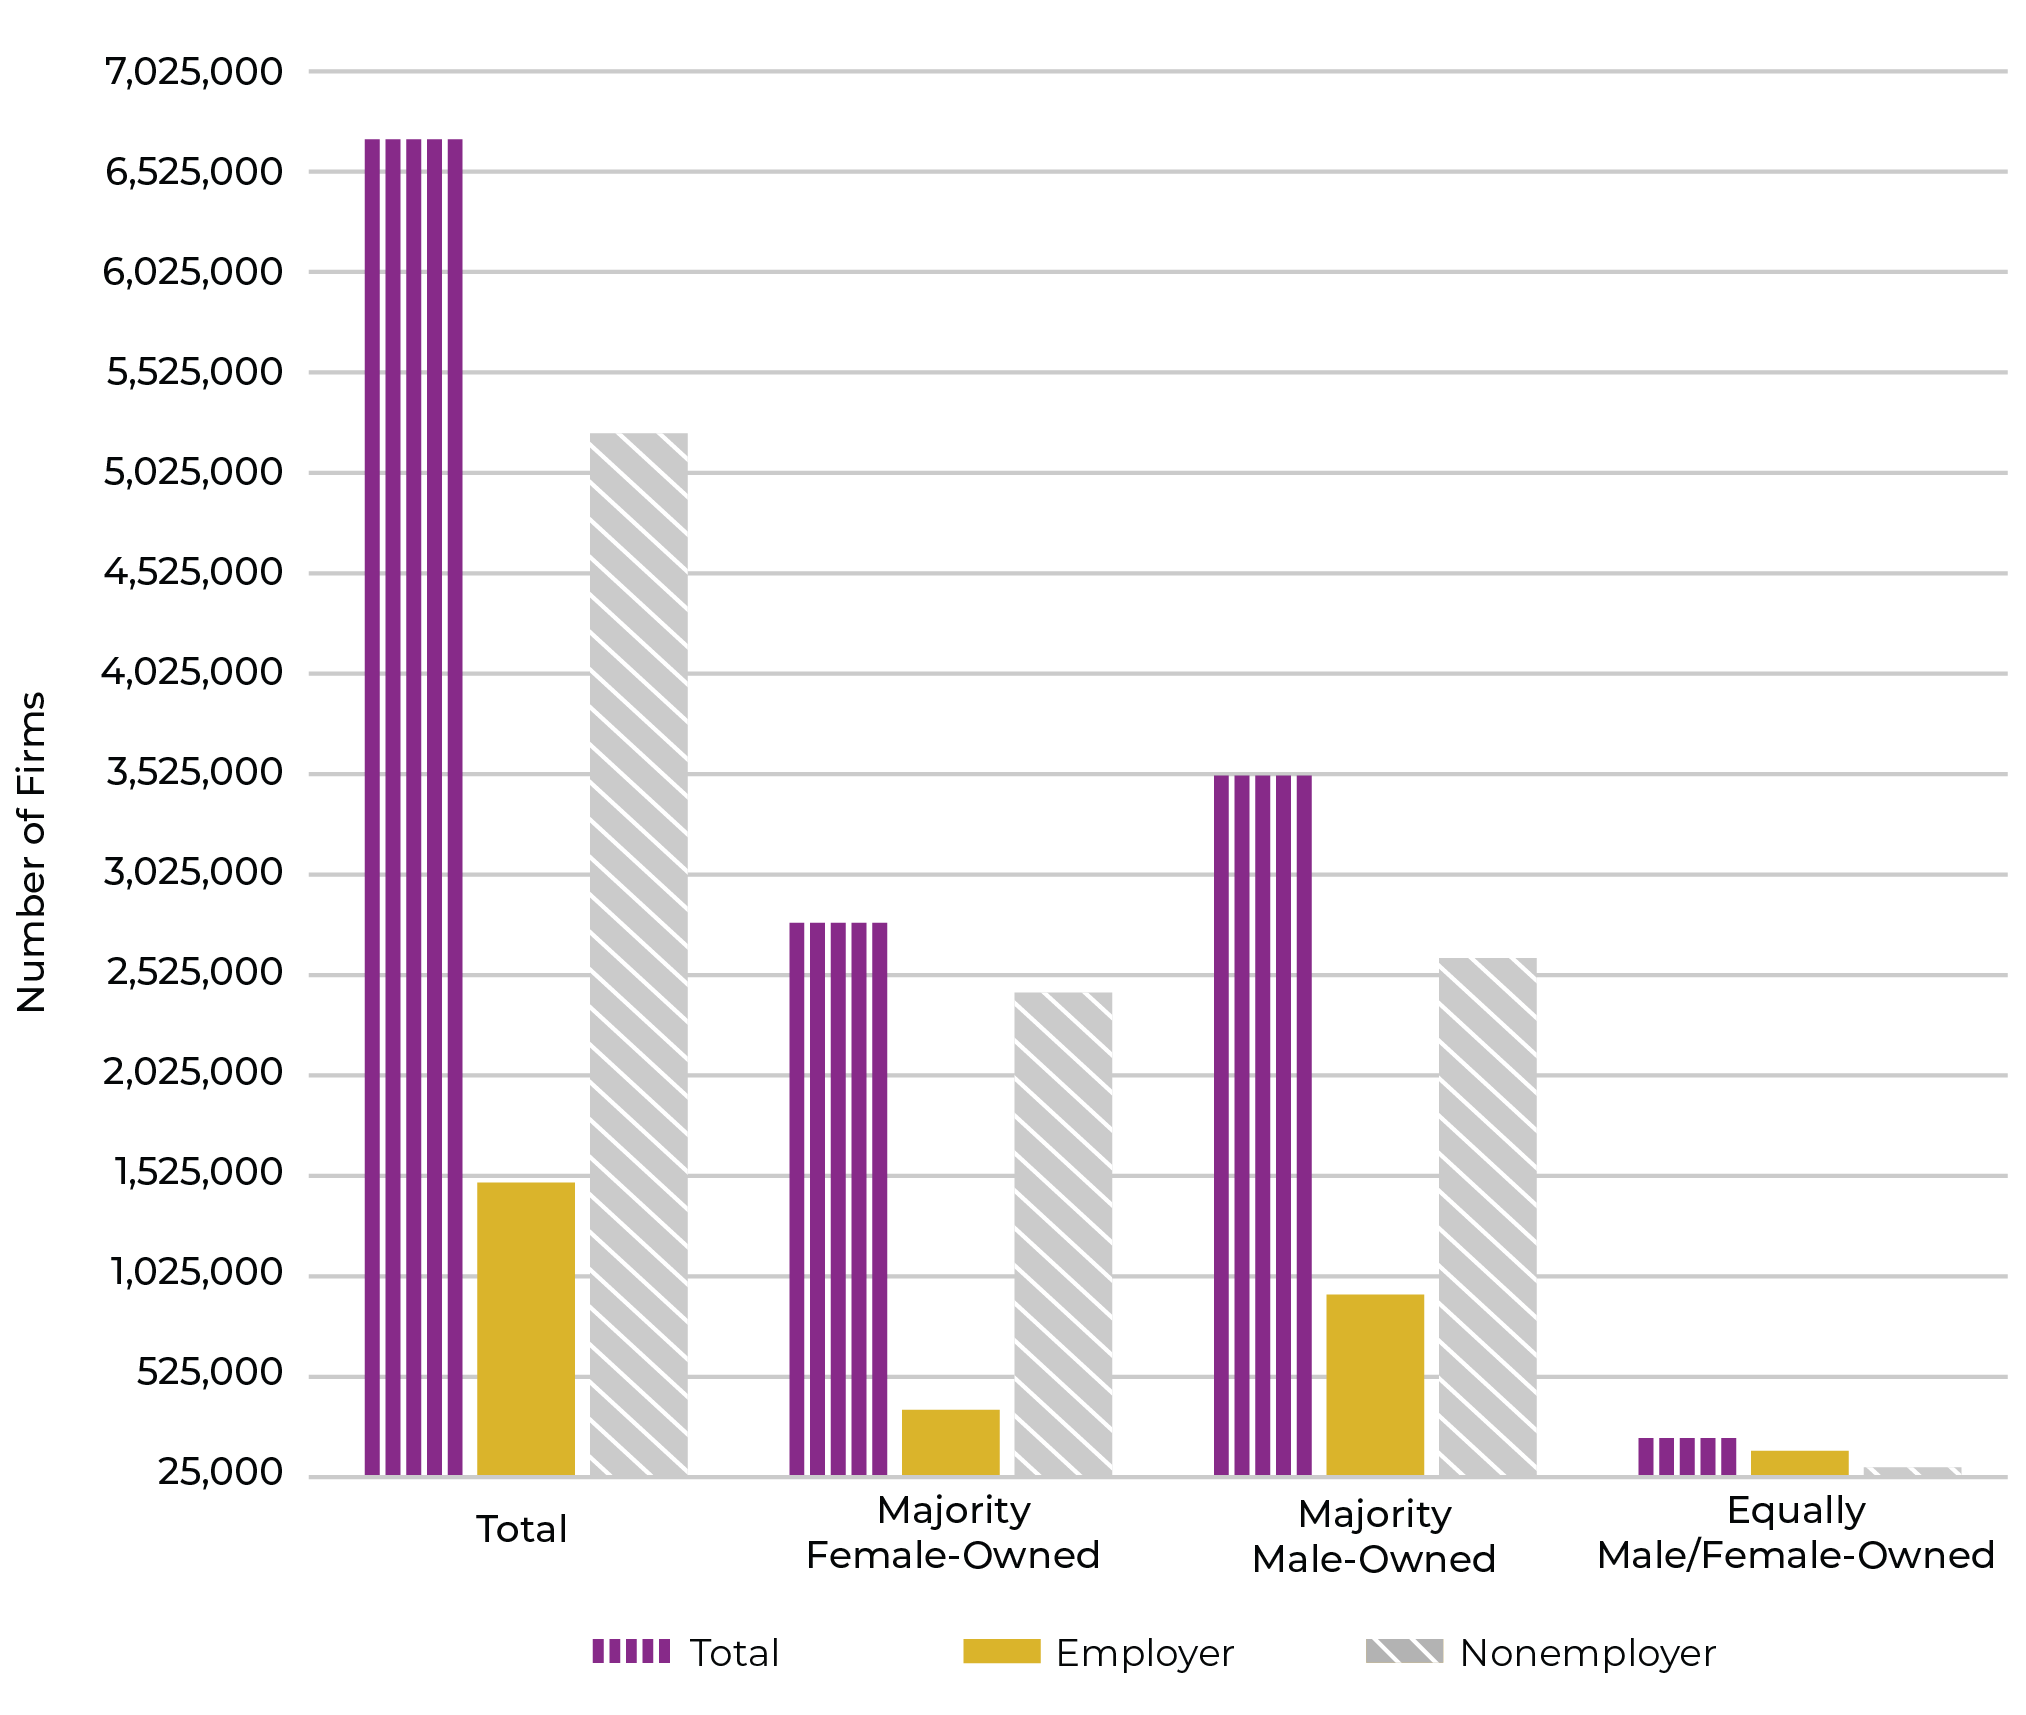
There is a more significant STEM entrepreneurship gender disparity amongst employer firms versus nonemployer firms.
This finding is in keeping with trends in entrepreneurship across sectors: women are more represented as owners of nonemployer firms than as owners of employer firms. Some potential factors influencing this disparity include that women have an easier time starting nonemployer firms and may do so due to the greater flexibility it grants and due to higher barriers to entry when starting an employer firm.
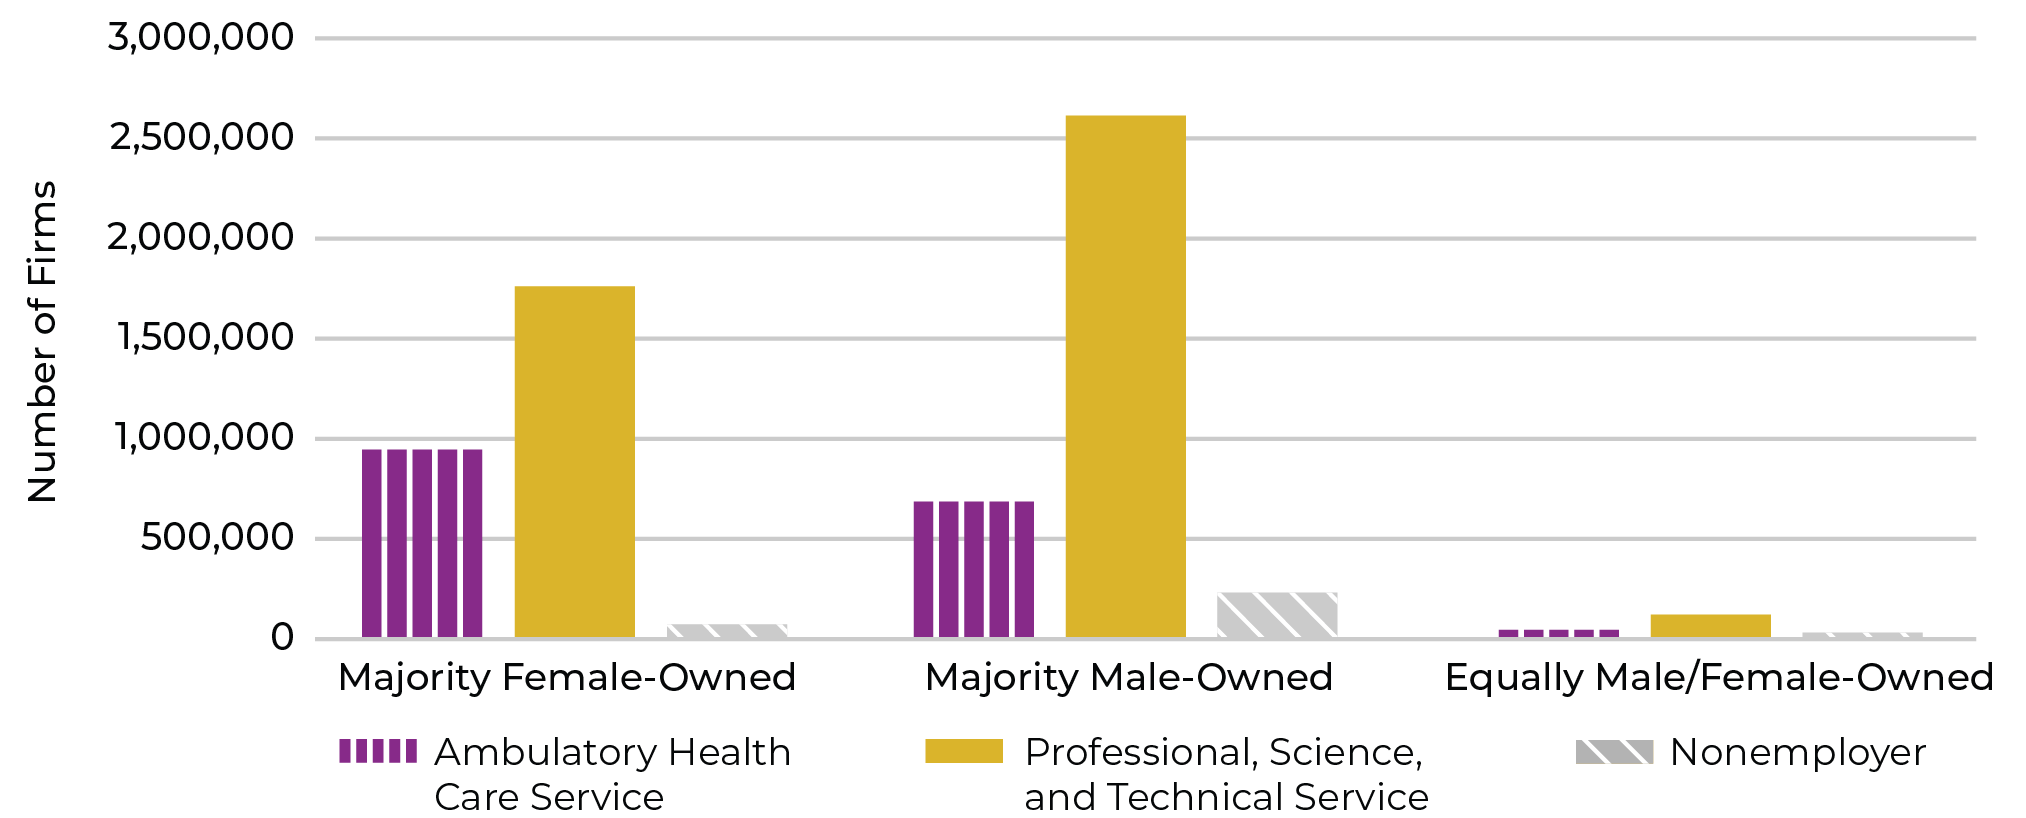
Most STEM businesses are concentrated in the Professional, Scientific, and Technical services sector, followed by the Ambulatory Healthcare services sector. The number of male-owned firms in the Professional, Scientific, and Technical services sector is nearly 1.5x that of female-owned firms. The high concentration of men-owned versus women-owned firms in this sector could explain some of the gender disparity in STEM fields overall.
STEM businesses are concentrated in the Professional, Scientific, and Technical services sector, and male-owned firms in this sector outnumber female-owned firms. Because of this, it may be beneficial to prioritize removing barriers for women in this sector.
Overall, there are more male entrepreneurs than female entrepreneurs in STEM industries. However, the same is only sometimes the case when the data are disaggregated by race and ethnicity.
Black/African American, American Indian, and Alaska Native women entrepreneurs in STEM outnumber their male counterparts. For all other categories, there are more men who own STEM firms than their female counterparts.
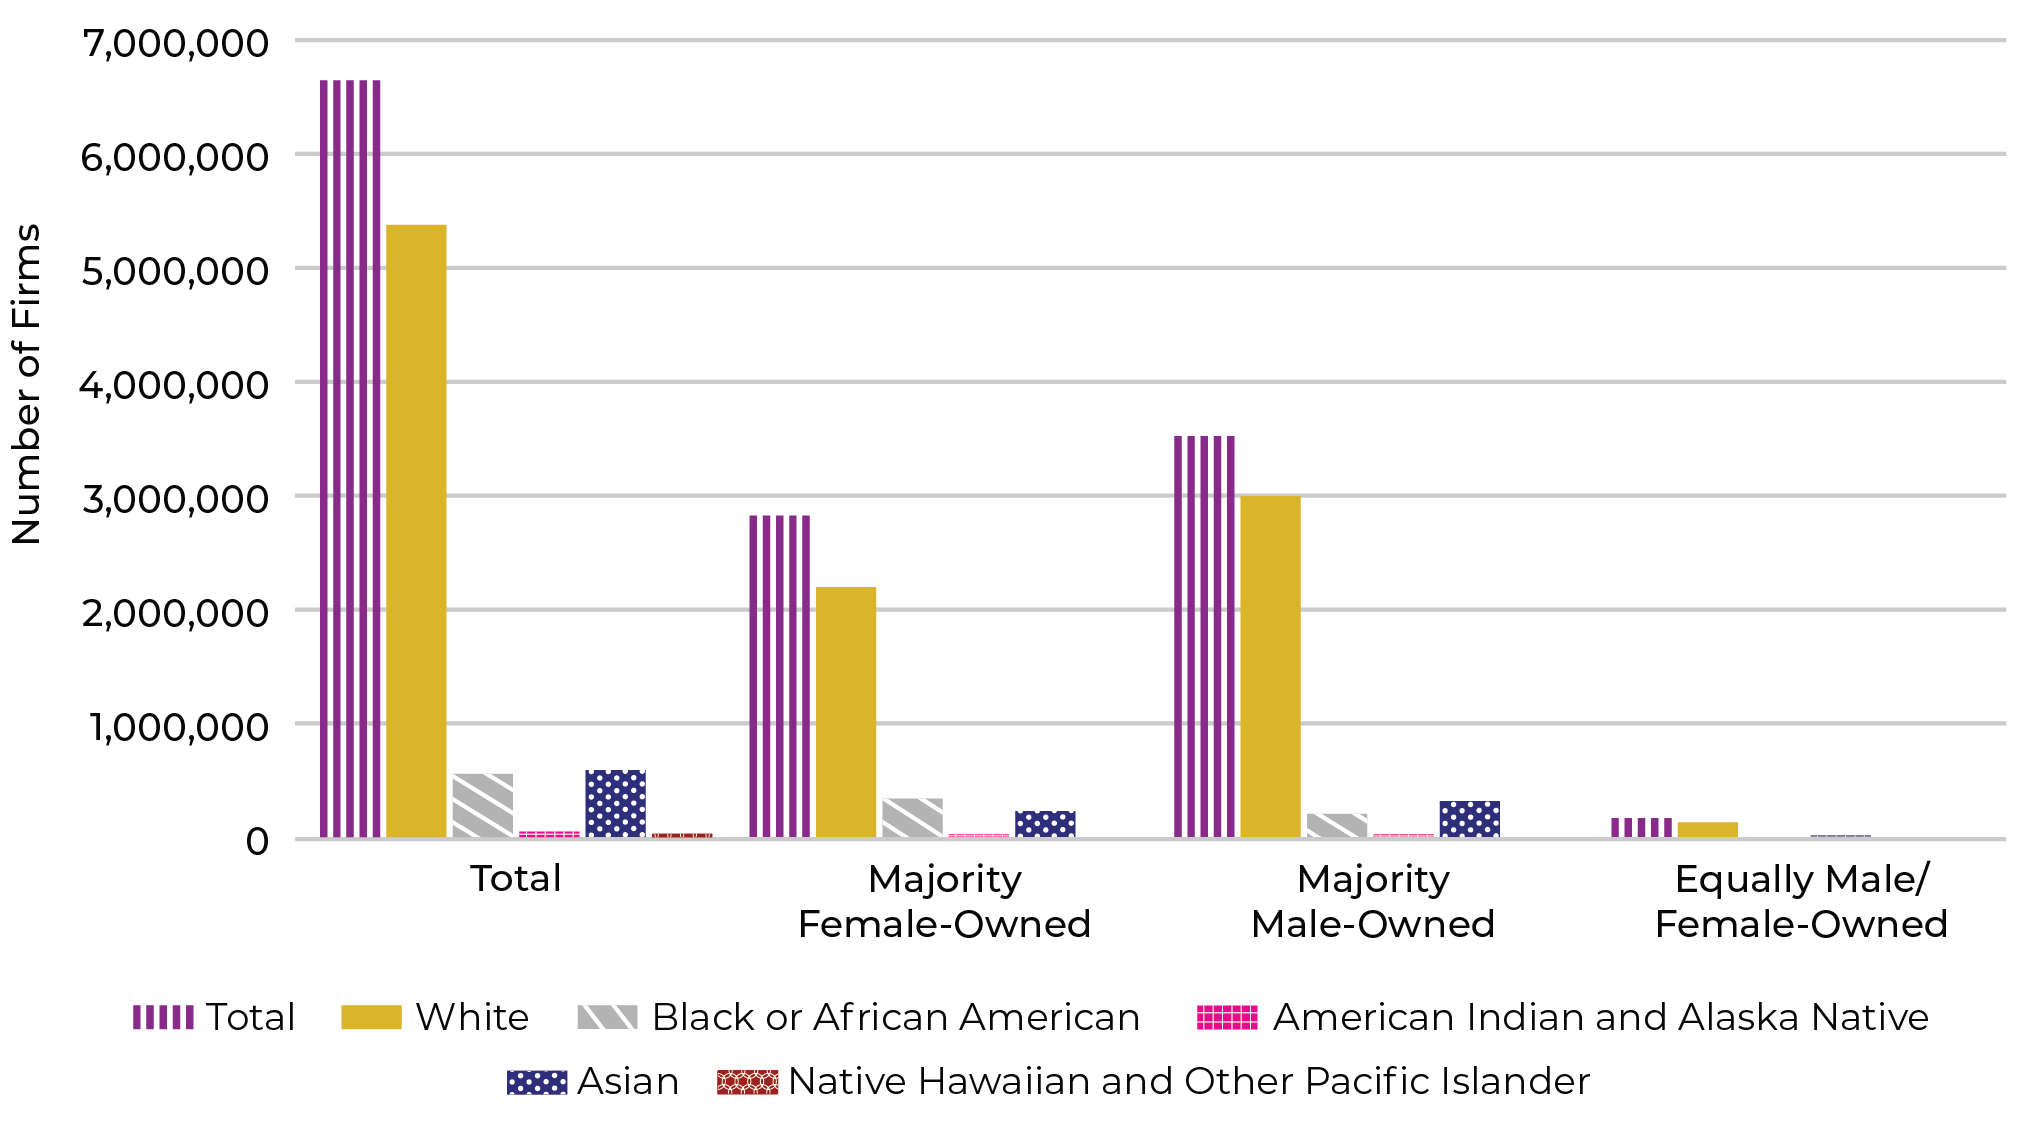
STEM firms owned by Hispanic women also outnumber the number of firms owned by Hispanic men. The finding that women of color are creating STEM businesses at an almost equal, if not greater, rate than their male counterparts has fascinating implications that will be explored through further inquiry.

Comparing geographic differences for STEM employer firms across the United States, the percentage of female STEM employer firms, compared to all STEM employer firms within a state, ranges from 0.4 percent to 89 percent. The state with the lowest rate of female STEM employer firms is Alabama at 0.4 percent. The two states with the highest rate of female STEM employer firms are South Dakota at 44 percent and Maine at 89 percent.
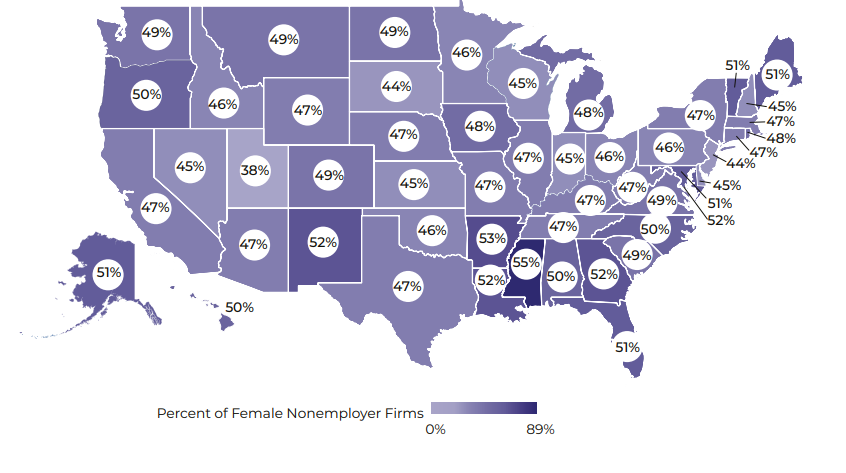
The percentage of female STEM nonemployer firms among all STEM nonemployer firms within a state ranges from 38 percent to 55 percent. Utah has the lowest rate of female STEM nonemployer firms, while the state with the highest rate of female STEM nonemployer firms is Mississippi.
There are noticeable differences amongst states when it comes to the percentages of STEM firms owned by women.
Factors influencing these variations could include a higher percentage of women working in the STEM fields, levels of education or availability of resources, capital, or technical assistance.
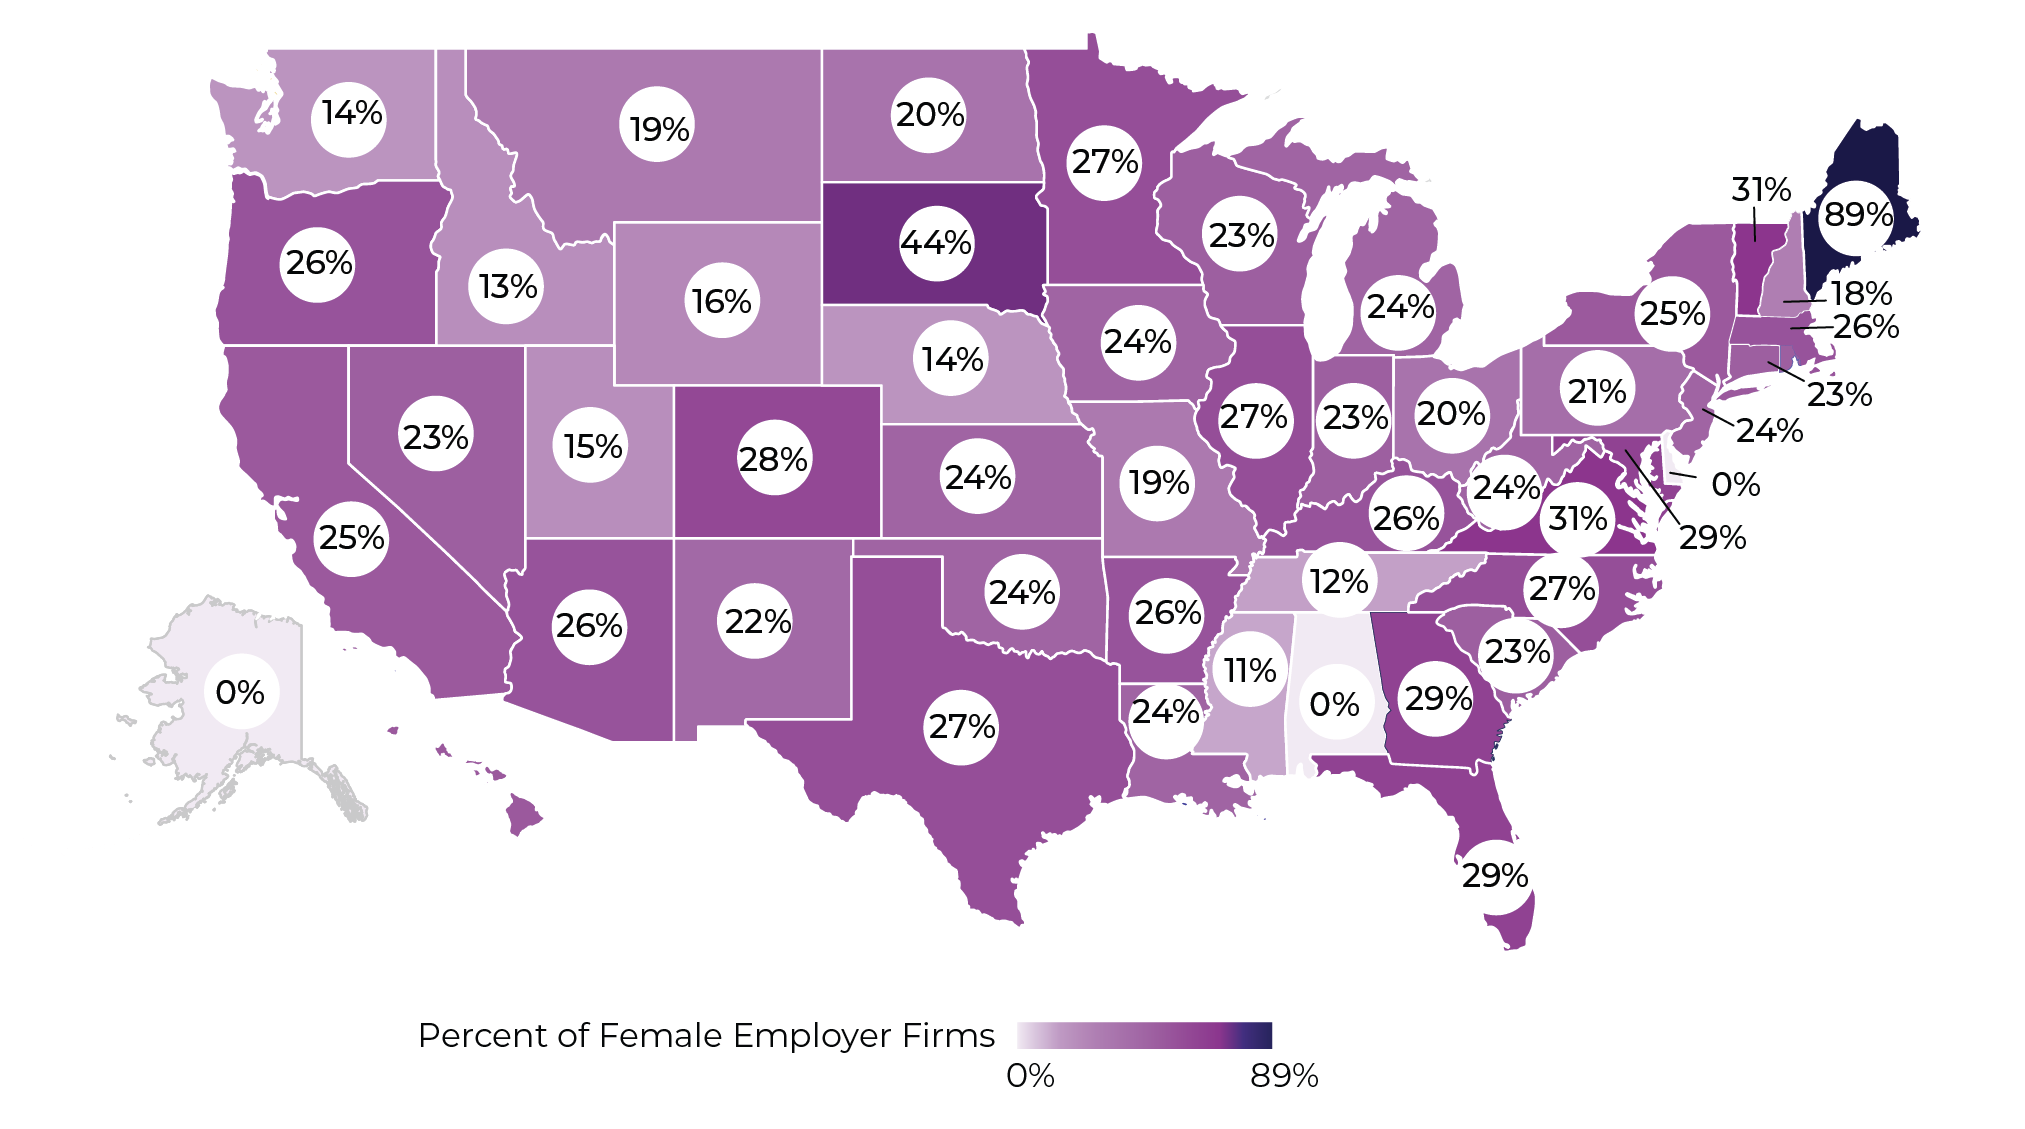
Note: For Alabama, Alaska and Delaware, the map shows 0 percent employer firms. In the case of Alabama, it is actually 0.4 percent, whereas for Alaska and Delaware, the data is either not reported or not disclosed.
Although there may be differences in women’s STEM entrepreneurship pertaining to employer vs. nonemployer status, industries, race, ethnicity, and geography, two themes are evident across the board:
These insights and more will be expounded upon in greater detail in the next fiscal year through continued research efforts.
Note: The sources for these figures and data points were the U.S. Census Annual Business Survey (ABS) and NES-D. 2019 is the most recent year where data was available relating to STEM entrepreneurship for both employer and nonemployer firms. Hence, the figures and the data represented are a snapshot in time and do not capture changes over time. In some instances, data were omitted from the figures or are not visible because the number of firms is too small to represent relative to the other categories displayed.
The second of the two research projects being conducted, in partnership with dfusion, focuses on how women pursue entrepreneurship in rural, tribal, and historically underserved communities. Below are the major learnings captured thus far from a literature review investigating trends in more detail.
There is a need for increased representation across the board in spaces that support women’s entrepreneurship and for specific communities of women. Policymakers, investors, mentors, and other members of entrepreneurial networks would benefit from the increased participation of women from different backgrounds. Women across all groups investigated noted that having peer mentors who understood their circumstances as underserved populations would greatly affect their capacity to become and remain entrepreneurs. Similarly, having representation throughout entrepreneurial networks and among policymakers will increase the ability of entrepreneurial systems to support women entrepreneurs of different groups.
The number of women entrepreneurs, when compared to male entrepreneurs in rural areas, is significantly smaller than in urban areas. Women own 44 percent of businesses in urban areas and only 40 percent in rural areas.
| Number of Firms per Location | Women-Owned (n) | Men-Owned (n) |
|---|---|---|
| Urban | 8,417,000 | 10,650,000 |
| Rural | 1,504,000 | 2,223,000 |
| Not Classified | 1,211,000 | 1,697,000 |
Notes. Data retrieved from Agritourism Overview - National Agricultural Law Center (n.d.), ABS (2021), and NES-D (2019).
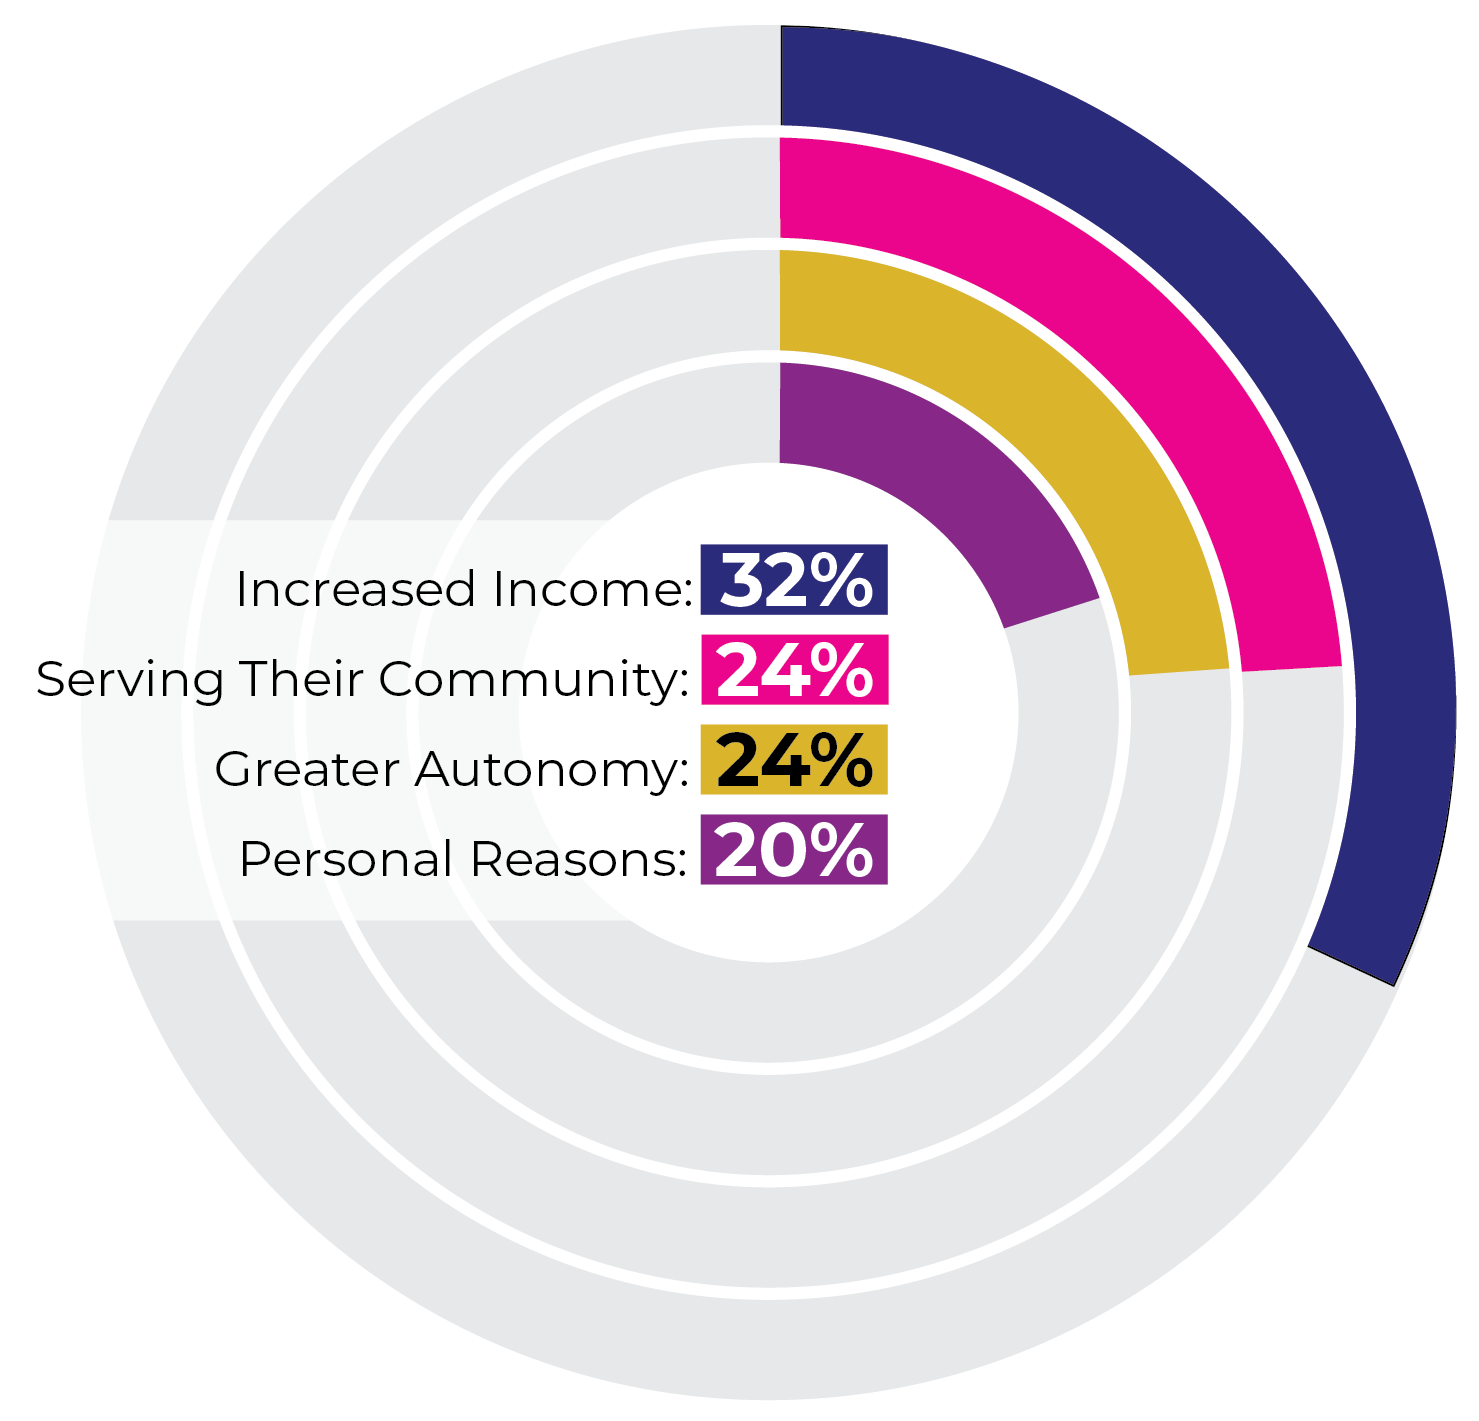
The motivations for starting and owning a business among Tribal women and the definition of “success” varies from the typical “Western” ideology. As noted in prior research “research with Native Americans has shown that perceived ‘wealth’ is determined, in part, by sharing and providing rather than defining success based on money. There is a focus on the community as a collective and success is based on those contributions, regardless of their financial value.”6 A survey of 100 Tribal women entrepreneurs found that while 32 percent of respondents’ primary motivation was increased income, 24 percent were primarily motivated by serving their community, and 24 percent were motivated to have greater autonomy, not necessarily personal autonomy, but of their tribe as well.
The proportion of women-owned businesses from different racial and ethnic minority groups, as well as the revenue generated by those businesses, is increasing as women play more prominent roles in the U.S. market. Women entrepreneurs represented some of the fastest-growing demographics amongst entrepreneurs before and following the COVID-19 pandemic. However, women of racial and ethnic minorities’ participation in the U.S. market still lags behind men’s and White and non-Hispanic women’s.
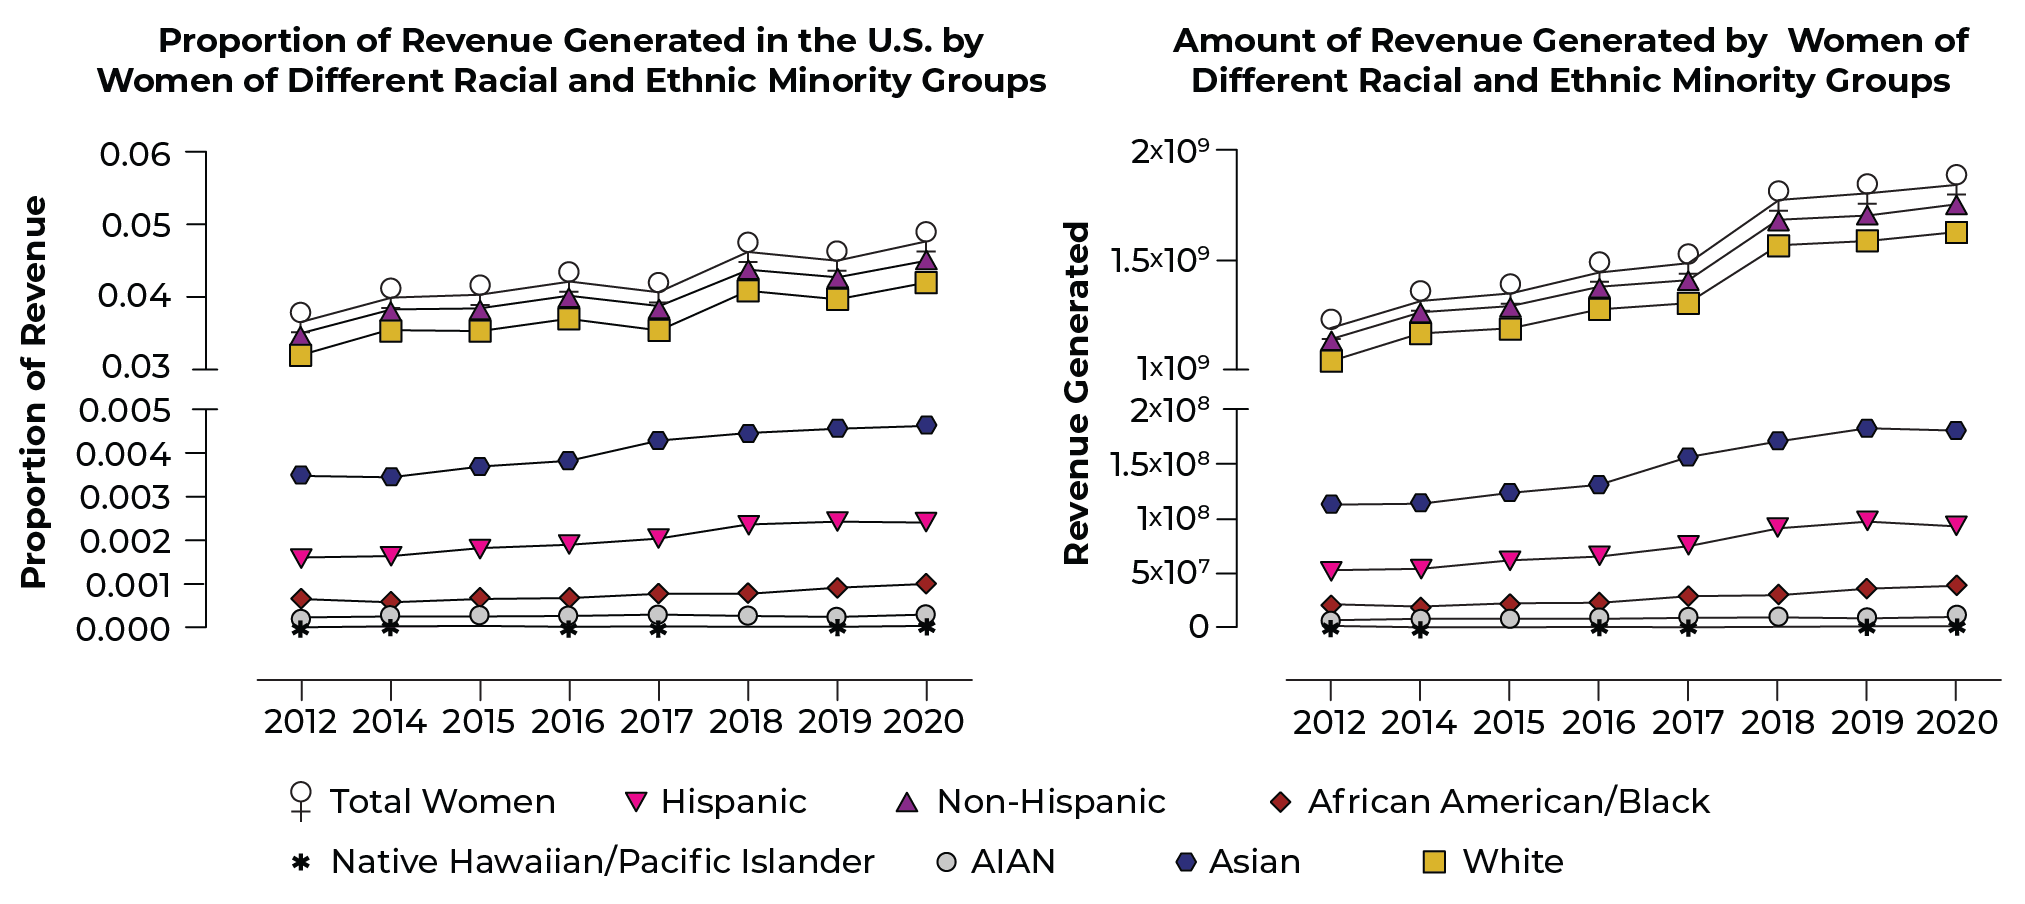
Data retrieved from ABS 2021. Please note the scales of each y-axis.
Different groups of underserved women have common problems:
However, shared challenges do not mean the challenges are homogeneous. Each group has specific needs and barriers unique to that group. Different groups experience different types of discrimination, have differential access to resources, and have differing ideologies around what a “successful” entrepreneur is. Thus, it remains important to target specific populations for any policy recommendations to improve women’s entrepreneurship among underserved populations.
Women entrepreneurs are different. They start different businesses for different reasons with different types of financing in different spaces. Rather than asking women to measure up to criteria not designed with them in mind and to meet the expectations of lenders, investors, and grantors who do not look like them, it’s time to start from scratch. Institutional change cannot happen by making small tweaks to an unstable foundation. Instead, it needs to be from the ground up. Data such as these give us a blueprint upon which America can, to quote the President, “build back better,” and to quote the SBA Administrator, “build an economy that works for everyone.” Let’s break new ground together and ensure women from all walks of life, races, ethnicities, and communities are leading this change.